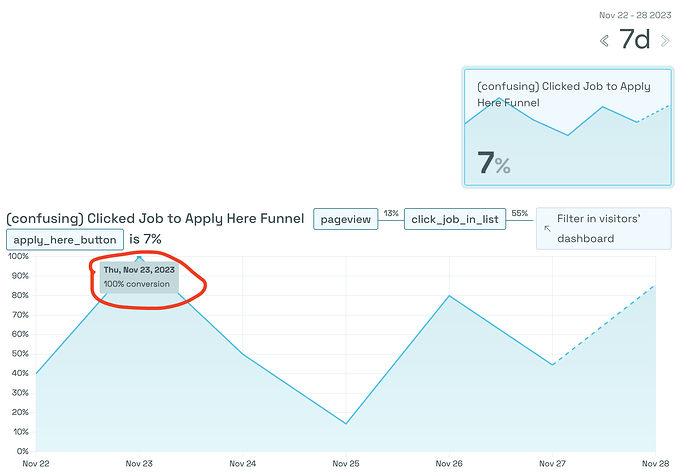
Hey all, realize this may not technically be a bug but it’s very confusing for funnel metrics. I created a funnel using 3 metrics. In the case of my job board website: (1) unique page views (2) clicking a job (3) clicking apply.
Expected Behavior
I would expect each day’s % in the histogram to show the smaller conversion % of users who clicked a job and clicked apply.
Actual Behavior
Instead, it shows: of all the users who clicked a job that day, what % also clicked apply here.
e.g. For the following funnel:
pageview – 10% → clicked job – 50% → apply here
The end-to-end conversion is 50% x 10% = 5%. But that day on the histogram would show 50%. I would like to see the end to end conversion % each day to tell (a) are users making it all the way through (b) see this with % so its independent of my traffic.
Steps to Reproduce the Problem
- Create a funnel using 3 metrics
- Select it from goals tab
- Click the histogram view
- See that each point in the graph shows % of users who converted from 2 to 3, instead of from metric 1 to 3.
Specifications
- URL: https://simpleanalytics.com/goals/mywebsite?start=2023-11-07&end=2023-11-13&interval=day&goal=visit-to-apply-here-funnel
- Browser: Chrome
- Operating system: macOS
