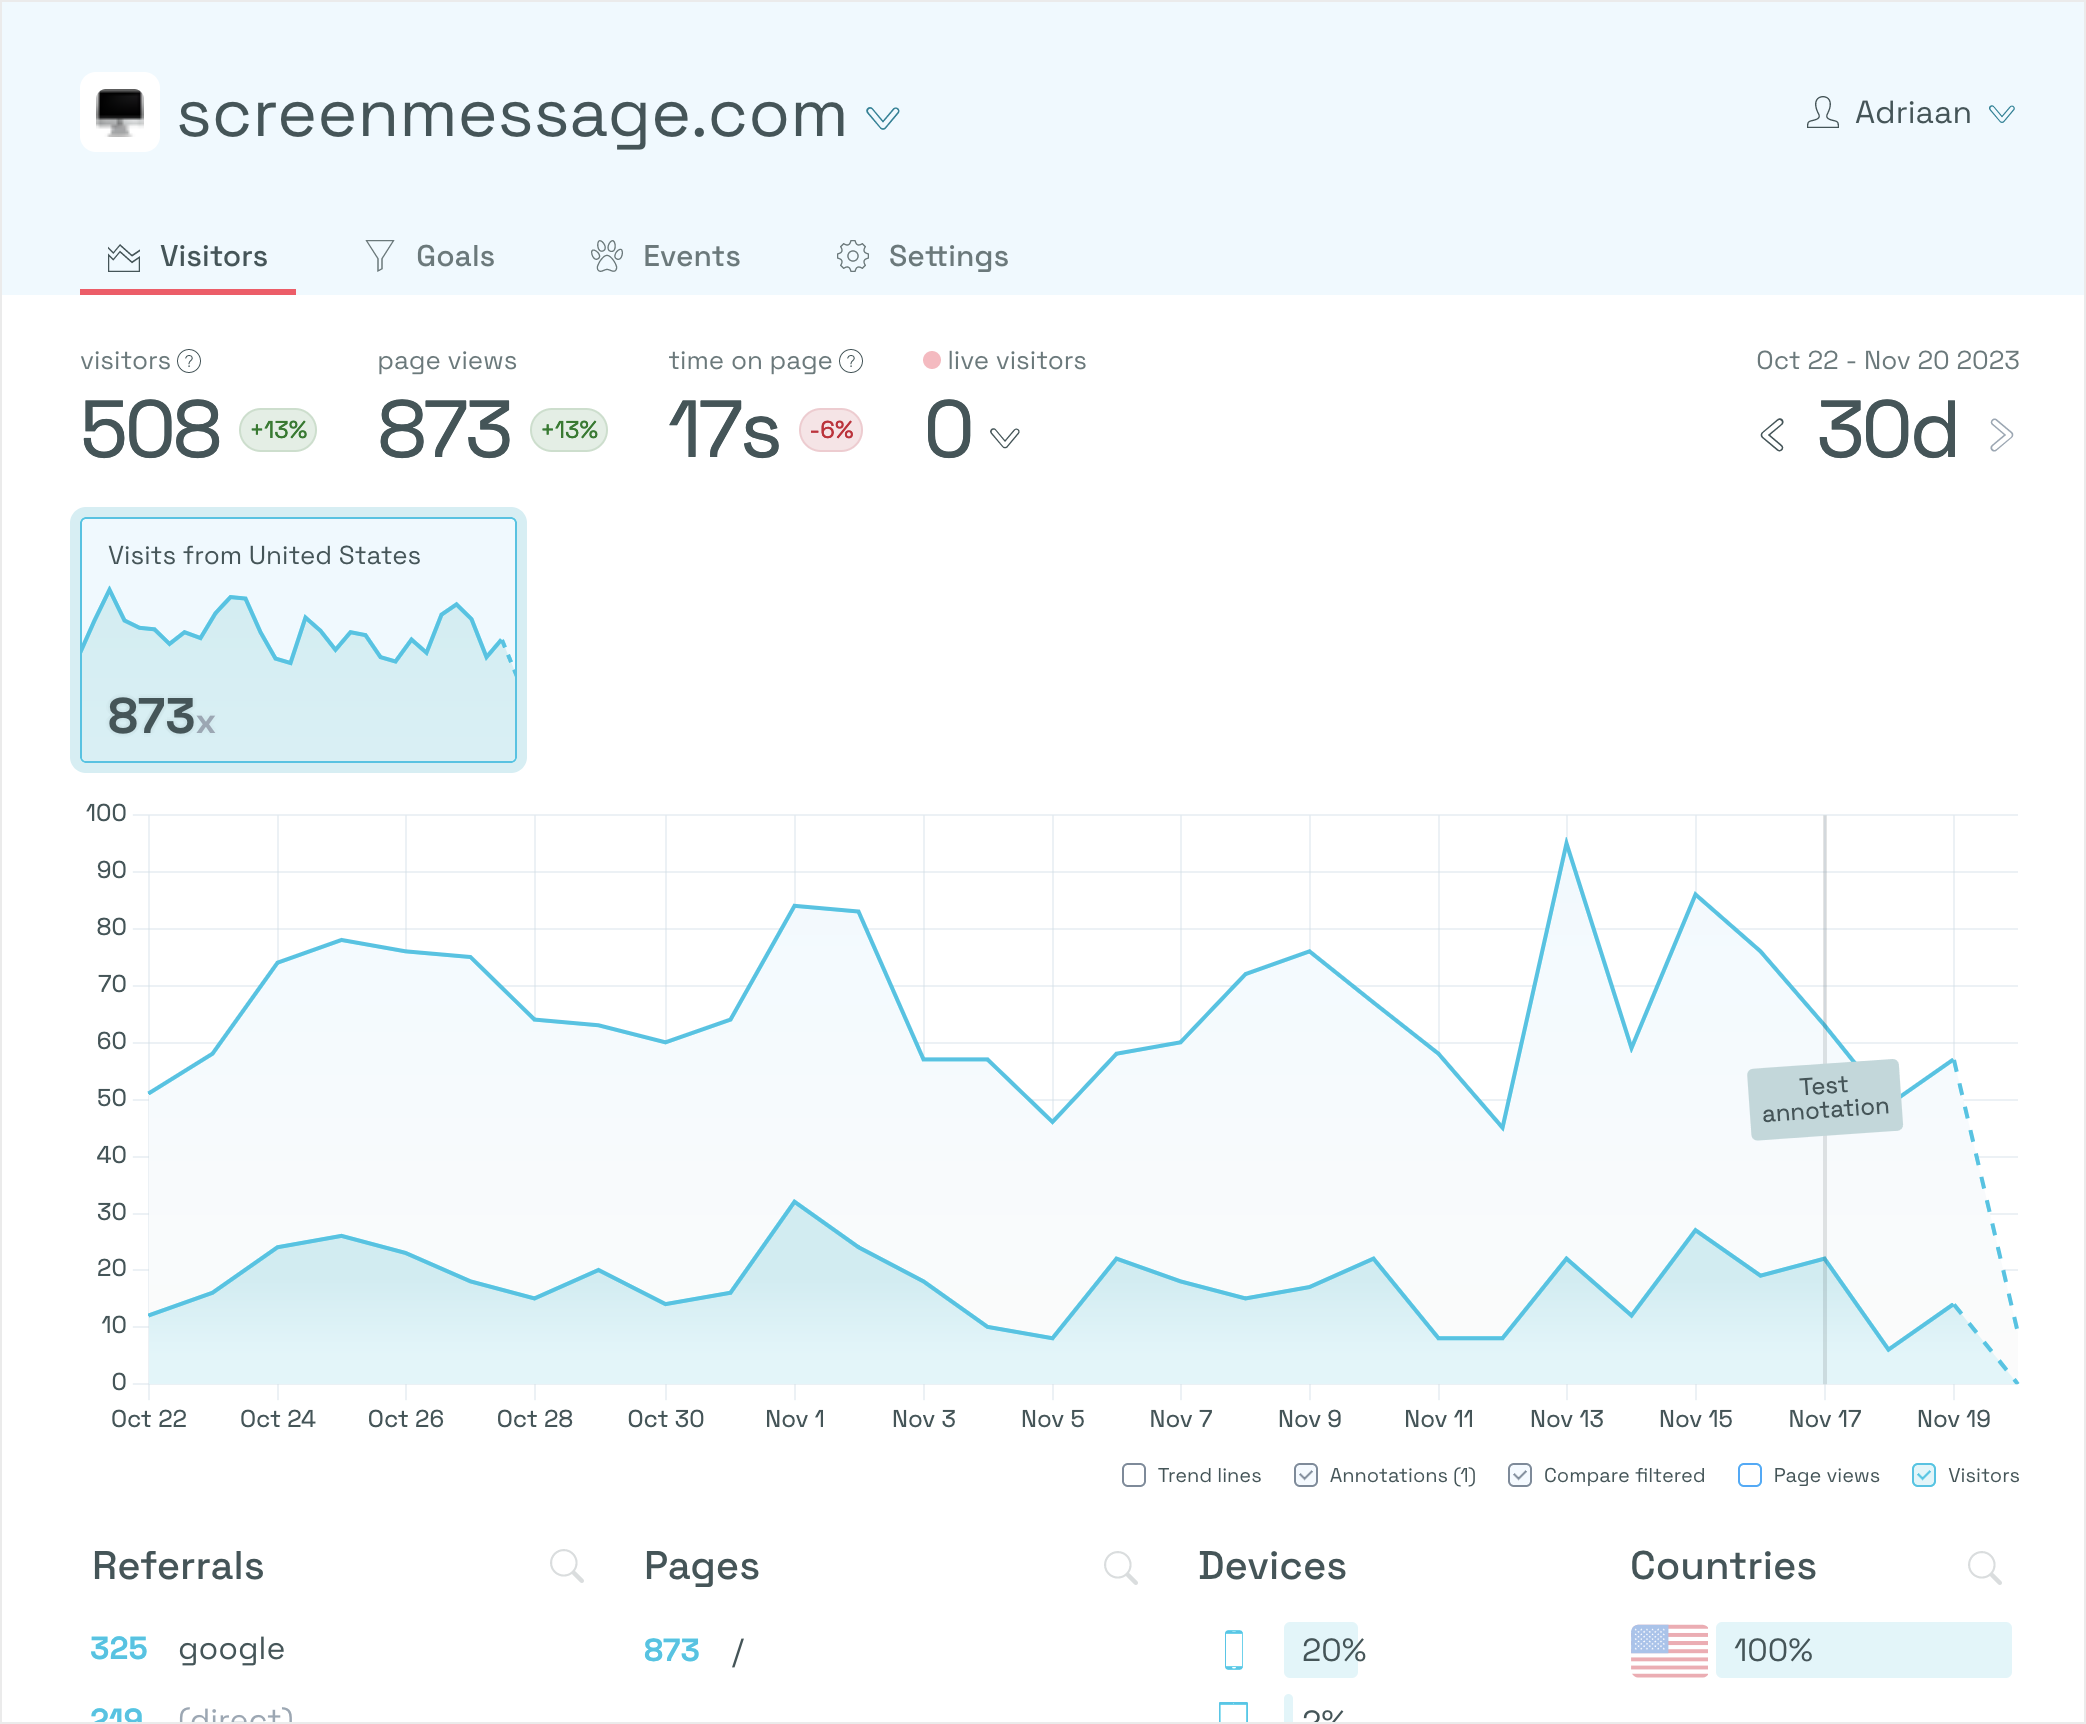
Annotations visible within a goal’s histogram view.
What is your use-case?
Example: I run a job board. Let’s say I make the apply here button bigger. I want to know whether that increases the % of users who click apply here. I want to add a “Bigger Button” annotation, then see the % of users who apply before and after the annotation. Currently, I can only view the number of users who click apply before and after, which isn’t as useful.
How does it help other customers?
I would image any Simple Analytics user doing A/B tests would want to view their funnel metrics as a % instead of the number, since the number could fluctuate due to total traffic.
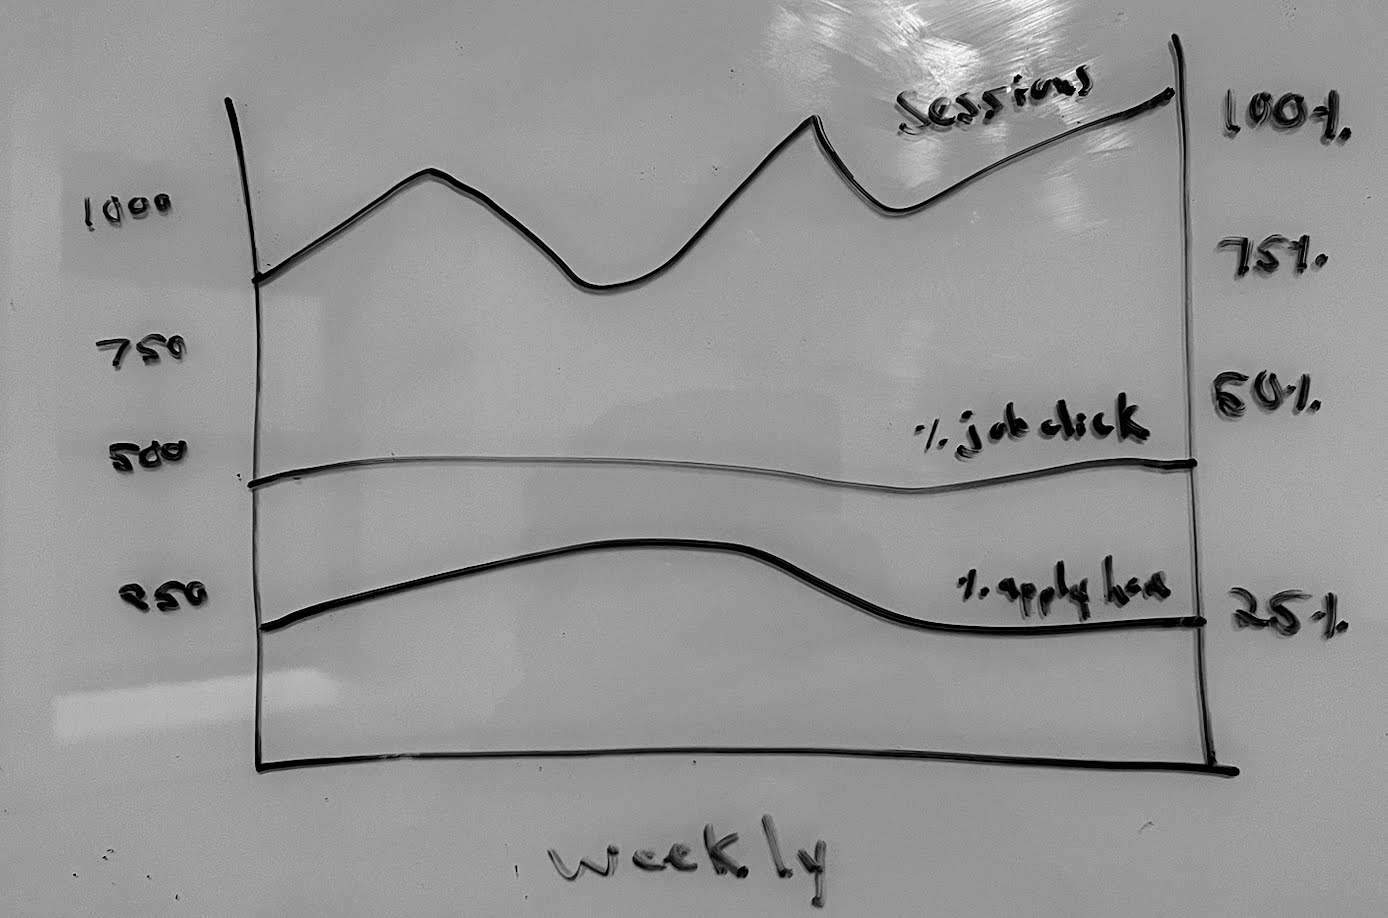
I would like to expand on this. It would be ideal if each metric from my funnel was graphed as shown in the screenshot, so we could see how each part of our funnel is performing every day. Let me know what you think, and thanks again for the help
I see what you mean. I am not sure if that still falls into the “simple” category. We need to carefully decide which features to do while keeping it simple for the end user.
At the same time, if everybody loves it, we should do it. Will keep this open for a bit.